
When deal values drop and capital becomes more expensive, how do you evaluate and decide on the best financing options to salvage your deal?
In a typical CRE investor’s experience, one would acquire an asset using leverage to enhance and amplify returns. Ideally, the value of that asset (and the investor’s underlying equity) appreciates – through some combination of improvements to the underlying financial performance and/or market conditions.
When this happens, the owner has a number of attractive options: enjoy higher yields and improved returns, sell the asset for a higher price, or refinance at a higher value and pull equity out. Let’s look at those three scenarios with a hypothetical asset purchased at $100m that increases in value to $130m, with equity increasing from $35m to $65m.
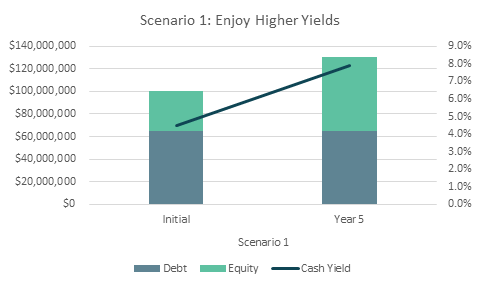
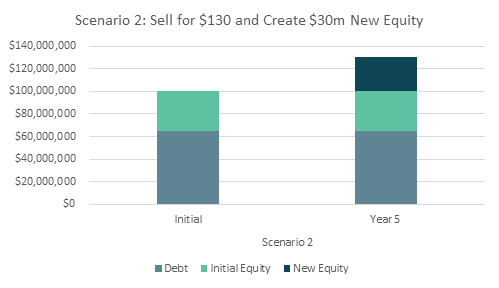
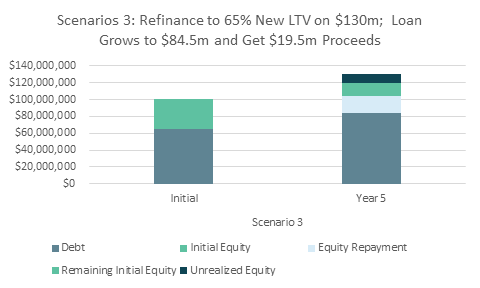
*Scenarios above assume going in NOI of $4,000,000, a going in cap rate of 4.0%, debt at 3.75% (interest only) and annual NOI growth of 6.78% over 5 years.
But what happens when real estate markets turn, and interest rates increase significantly?
Real estate deals may be impacted and no longer worth as much – requiring investors to explore more challenging decisions.
For that same deal that was acquired at $100M with a typical 65% loan, the market conditions suggest a 30% drop in value. That means if sold today it would be worth $70M, and that $35M of equity invested is now worth only $5M. That’s brutal!
Most investors would prefer not to sell right now, especially if they believe there is an opportunity to recover their investment, so they will try to hold on and kick the can down the road until a more favorable time. However, there are often additional issues associated with the loan that may make this situation more complicated as the drop in value, maturity date of the loan, and/or changes in interest rates may trigger more immediate action.
For example, that $65M loan on the $100M property has a LTV (‘loan-to-value’) of 65%, but if the property is impacted and is now valued at $70M, that same loan would have a dangerously high LTV of 93%! In addition, if the loan happens to be maturing and/or floating (more common with bridge, construction, rehab, etc.), the required Debt Yields and DSCRs may now no longer be sufficient to meet the lender’s requirements.
|
Low Interest Rate Environment |
Value of Property to Investor's Today |
Value to Owner in today's interest rate environment |
|
|
NOI |
$4,000,000 |
$4,000,000 |
$4,000,000 |
|
Cap Rate |
4.00% |
5.71% |
4.00% |
|
Value |
$100,000,000 |
$70,000,000 |
$70,000,000 |
|
Debt LTV |
65% |
65% |
93% |
|
Debt Amount |
$65,000,000 |
$45,500,000 |
$65,000,000 |
|
Equity Amount |
$35,000,000 |
$24,500,000 |
$35,000,000 |
|
Rate |
3.75% |
5.75% |
5.75% |
|
Debt Payment |
$2,437,500 |
$2,616,250 |
$3,737,500 |
|
Excess Cash |
$1,562,500 |
$1,383,750 |
$262,500 |
|
Cash Yield |
4.5% |
4.0% |
0.7% |
|
DSCR |
1.64 |
1.53 |
1.07 |
|
Debt Yield |
6.15% |
6.15% |
6.15% |
If the borrower would like to keep the (or any) loan in place, there is proactive action to bring the capital stack into a healthier picture. And similarly, most lenders would prefer not to foreclose on the property or sell the loan below par, especially if there is a reasonable likelihood for full return of principal. (For deals that are valued well below their debt value, that is likely a different story for a different post.)
This is what is currently in play right now.
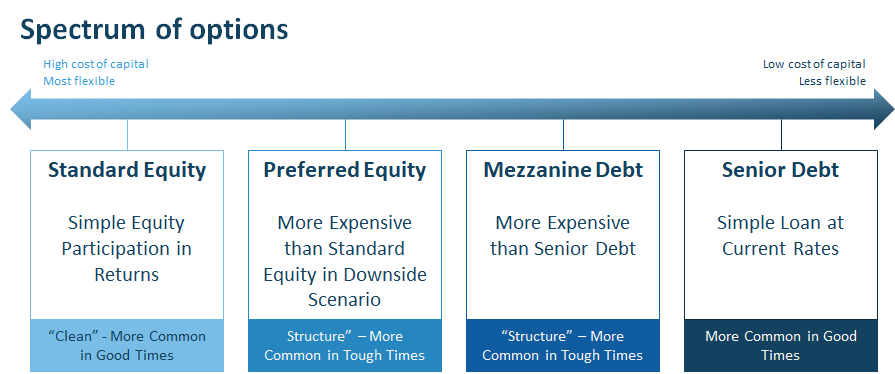
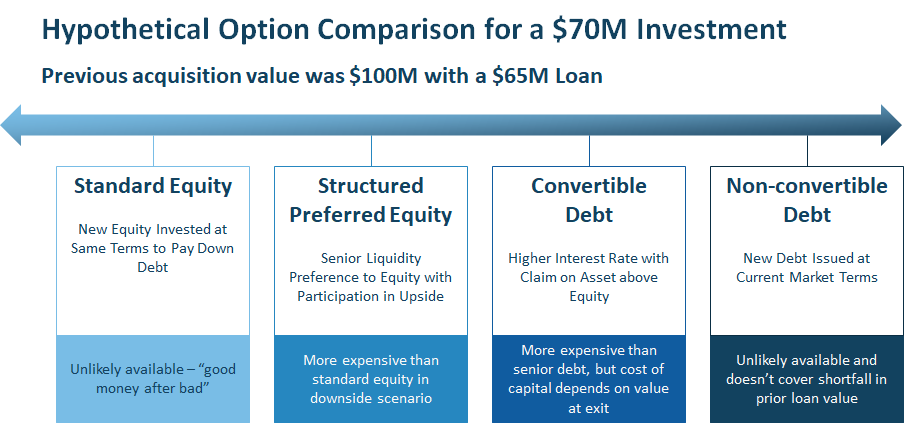
The equity-to-debt spectrum
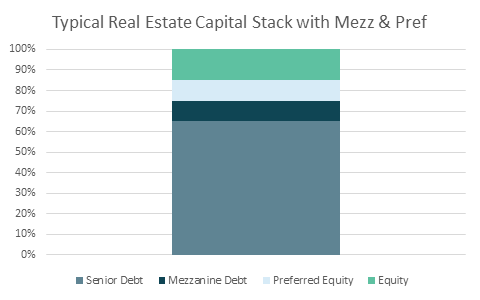
In practice, different options and terms can be combined, and in later sections, we’ll dig into both specific terms used to sweeten equity proposals and a side-by-side comparison of common scenarios. For simplicity, though, let’s look at four high level options: standard equity, preferred equity, mezzanine debt, and senior debt. These options can roughly be thought of on a spectrum that trades cost of capital and dilution for flexibility.
PIK Interest
What it is: Rather than paying cash on a quarterly or annual basis, payment-in-kind, or “PIK”, compounds the original investment of the security with all structure and protections included. These PIK payments can appear as dividends in equity deals, and as accruing interest in structured debt deals.
For example, a $100M note with a 10% cash interest rate would pay out $10M in interest and still have $100M in principal after one year, while a 10% PIK interest rate would pay out nothing but have $110M in principal after one year. After another year, the cash interest note would pay $10M and still have $100M in principal, but the PIK interest note would again pay nothing and have $121M in principal (i.e., 10% of $110M=$11M and $110M+$11M=$121M). Note that all features and terms of the original note would be preserved with the PIK. For example, if there was a liquidity preference, that would apply to all $121M of the principal, not just the original $100M.
Why it matters: PIK interest means no cash outflows for the duration of the time the accruing equity or debt is outstanding, but leads to a greater % of ownership, a structured equity deal, or more principal at the end of the term. This can mean more dilution or a larger cash outlay on repayment. Often, these PIK payments are compounding, so investors receive additional dividends or interest on dividends or interest paid, which can add up quite significantly.
Governance provisions
What it is: Structured transactions often carry stronger governance provisions and added blocks for investors. One of the most common governance provisions is around disposition decisions, which refers to deciding when to sell and for how much.
Why it matters: Optionality is valuable to investors, especially since they are stepping into an already impacted opportunity.
Hypothetical scenarios/term sheets
Now that we’ve laid out some of the most common structured terms, let’s look at how this plays out in different financing scenarios. To set up our scenarios, let’s imagine sold and was financed at a $100M value. Since that investment, the market has become tougher, and the owner is in the position of having to quickly fill the gap on their capital stack.
Since the two most likely situations are Preferred Equity and/or Mezzanine Debt, we’ll dive into both below.
Scenario 2: Preferred Equity
Equity position in the capital stack that is subordinate to any senior or mezzanine debt, but has priority over typical LP/GP equity. It is an additional way to increase players in the capital stack and decrease the portion of traditional equity.
Typical Preferred Equity term
|
IRR |
Upside Kicker |
Hold Period |
|
|
Preferred Equity |
10-15 |
10-20% |
Length of senior debt but can have early outs with equity return targets |
Pros:
- Way to increase leverage with a preferred equity position to increase the overall returns of the equity holders.
- Preferred equity positions often have some backend earn outs making them more likely to act as a partner during lean times, but any missed payments could lead to accrued returns.
- Typically, faster funding then trying to raise more common equity.
Cons:
- Preferred equity positions can consume a majority of the excess cash flow, making any return to the equity holder reliant on gains from disposition
- This is an equity position, so interest payments are not able to be written off unless the Preferred Equity payer is willing to claim the interest as debt and not income.
Bottom Line: Preferred Equity can be a fast solution to condense the amount of equity needed to close a deal, but it can diminish annual cash yields for the equity holders making the return reliant on back end disposition.
Return table below of an asset that was purchased for $100M at 65% LTV that is now worth $70M and needs to be restructured with Preferred Equity. The Preferred Equity of $20M pays off a portion of the original debt to lower the LTV to 64%.
The Preferred Equity pays 8% with a 15% equity kicker upon sale. The returns below are based on the Original Equity of $35M based on the original purchase price.
|
Preferred Equity Scenario |
|||||
|
IRR |
|||||
|
$70M |
$85M |
$100M |
$115M |
$130M |
|
|
7 Years |
-30.24% |
-18.59% |
-4.61% |
2.45% |
7.38% |
|
5 Years |
-43.58% |
-16.91% |
-3.10% |
5.49% |
11.91% |
|
3 Years |
-64.99% |
-20.82% |
-2.08% |
11.29% |
22.01% |
|
2 Years |
-69.79% |
-27.12% |
-1.69% |
18.33% |
35.40% |
|
Equity Multiple |
|||||
|
$70M |
$85M |
$100M |
$115M |
$130M |
|
|
7 Years |
.19x |
.31x |
.74x |
1.17x |
1.6x |
|
5 Years |
.13x |
.43x |
.86x |
1.29x |
1.72x |
|
3 Years |
.8x |
.51x |
.94x |
1.37x |
1.8x |
|
2 Years |
.11x |
.54x |
.97x |
1.4x |
1.82x |
|
Money Paid to Original Equity ($35M Initially Invested) |
|||||
|
$70M |
$85M |
$100M |
$115M |
$130M |
|
|
7 Years |
$6,475,000 |
$10,975,000 |
$25,975,000 |
$40,975,000 |
$55,975,000 |
|
5 Years |
$4,625,000 |
$15,185,000 |
$30,185,000 |
$45,185,000 |
$60,185,000 |
|
3 Years |
$2,915,000 |
$17,915,000 |
$32,915,000 |
$47,915,000 |
$62,915,000 |
|
2 Years |
$3,840,000 |
$18,840,000 |
$33,840,000 |
$48,840,000 |
$63,840,000 |
Scenario 3: Mezzanine Debt
Mezzanine Debt is a debt position that is subordinate to the senior debt, but has priority over any equity payments. It is typically originated through the senior debt originator and follows same terms as the senior debt with a higher interest rate.
|
IRR |
Hold Period |
|
|
Mezzanine Debt |
8-12% |
Terms are concurrent with senior debt |
Pros:
- Ability to increase leverage with a lower cost of capital than traditional equity or preferred equity.
- Typically originated along with senior debt so any terms and underwriting are being completed along with senior debt.
- Ability to write off interest payments for equity investors.
Cons:
- Senior lenders often have final say in how Mezzanine debt is structured.
- Potentially higher equity requirements on sponsor balance sheet to insure adequate funds for payment.
- Additional lender that could have say on how excess equity is treated and paid.
- Normally restricted to DSCR, LTV and Debt Yield Covenants.
Bottom Line: Mezzanine debt can be a solution to increase leverage at a lower cost than traditional equity. It can provide a lower WACC for debt payments to increase returns to investors without backend earnouts that can lower returns.
Return table below of an asset that was purchased for $100M at 65% LTV that is now worth $70M and needs to be restructured with Mezzanine Debt. The Mezzanine Debt of $20M pays off a portion of the original debt to lower the LTV to 64%.
The Mezzanine Debt pays 12%. The returns below are based on the Original Equity of $35M based on the original purchase price.
|
Mezz Debt Scenario |
|||||
|
IRR |
|||||
|
$70M |
$85M |
$100M |
$115M |
$130M |
|
|
7 Years |
-23.33% |
-7.22% |
0.36% |
5.54% |
9.52% |
|
5 Years |
-31.35% |
-10.14% |
0.36% |
7.71% |
13.46% |
|
3 Years |
-46.95% |
-16.58% |
0.36% |
12.94% |
23.21% |
|
2 Years |
-61.56% |
-23.99% |
0.36% |
19.85% |
36.59% |
|
Equity Multiple |
|||||
|
$70M |
$85M |
$100M |
$115M |
$130M |
|
|
7 Years |
.17x |
.6x |
1.03x |
1.45x |
1.88x |
|
5 Years |
.16x |
.59x |
1.02x |
1.45x |
1.88x |
|
3 Years |
.15x |
.58x |
1.01x |
1.44x |
1.87x |
|
2 Years |
.15x |
.58x |
1.01x |
1.44x |
1.86x |
|
Money Paid to Original Equity ($35M Initially Invested) |
|||||
|
$70M |
$85M |
$100M |
$115M |
$130M |
|
|
7 Years |
$5,875,000 |
$20,875,000 |
$35,875,000 |
$50,875,000 |
$65,875,000 |
|
5 Years |
$5,625,000 |
$20,625,000 |
$35,625,000 |
$50,625,000 |
$65,625,000 |
|
3 Years |
$5,375,000 |
$20,375,000 |
$35,375,000 |
$50,375,000 |
$65,375,000 |
|
2 Years |
$5,250,000 |
$20,250,000 |
$35,250,000 |
$50,250,000 |
$65,250,000 |
Paddle like a duck
For real estate investors and lenders, the job is to constantly be assessing the risk associated with the deals they are involved in or assessing. These more difficult market conditions will certainly present challenges to all players involved – which range from Operators salvaging a deal, Investors looking to deploy capital, Lenders evaluating the merits of their outstanding loans, and Brokers providing relevant assessments of value and advice.
The disposition market may visibly grind to a halt on the outside, but underneath everyone will be paddling like hell trying to make these structured deals work – to live to fight another day.
If you are finding yourselves in this situation trying to understand your options, Archer’s Underwriting toolkit can help you more effectively size up your deals.