After over a decade in the CRE investment space as a broker, investor, and proptech co-founder, here’s the uncomfortable truth: >95% of people underwriting a deal struggle to answer two basic questions:
- what are the actual components of your return, and
- which levers do you truly control?
That gap is where bad decisions (and “mystery alpha”) hide.
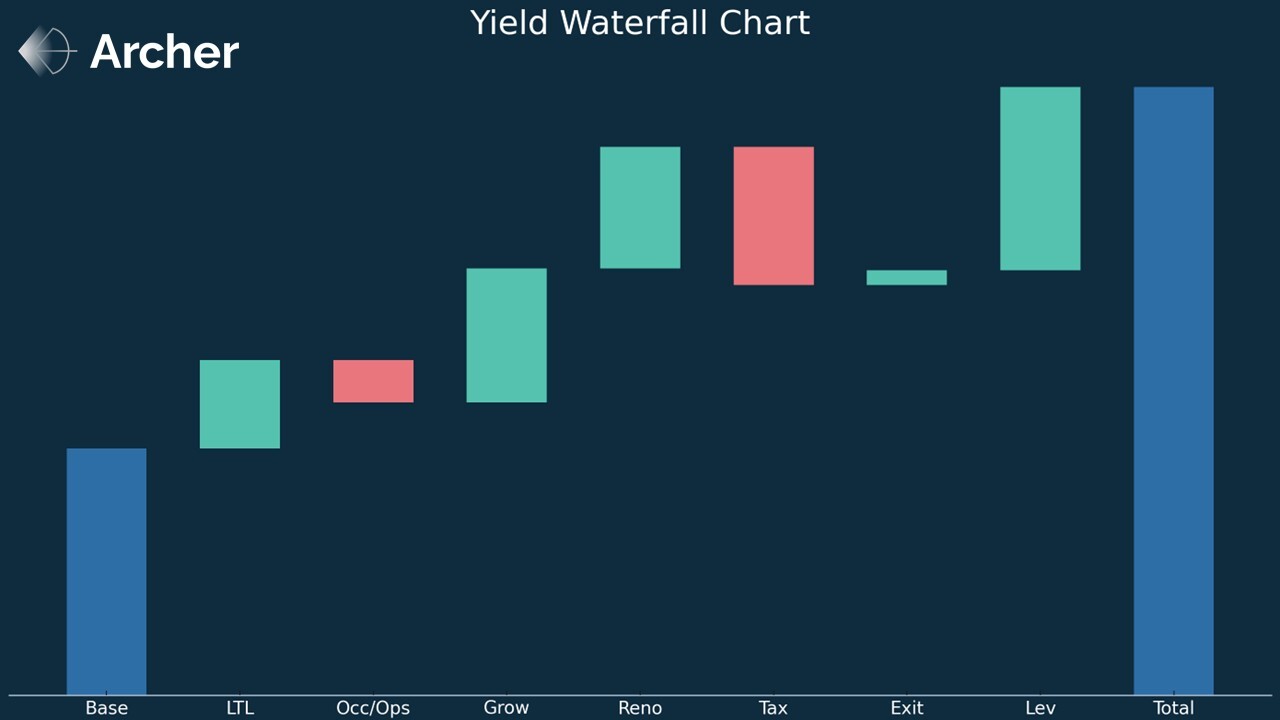
Below is one of the most useful charts in real estate: a yield components waterfall. It decomposes total return into the building blocks that move it—then forces a conversation about alpha vs. beta, control vs. exposure, and where software + AI now change the game.

Sample output (bps contribution to yield):
-
Loss to lease: +251
-
Occupancy / Ops: –121
-
Growth rates: +380
-
Renovation: +345
-
Taxes: –392
-
Exit cap: +42
-
Leverage: +519
(Base yield 7.0% → Total ≈ 17.2%.)
Alpha ↔ Beta: a working scale for CRE returns
-
Beta (0–1): market exposure you largely take (macro rents, exit yields, cap-rate regime). Tools help you measure/price it, but you don’t control it.
-
Semi-systematic (2–3): execution and information advantages that many can reproduce once the playbook is known (e.g., dynamic pricing).
-
Alpha (4–5): repeatable, firm-specific edge from sourcing, execution, and data feedback loops that don’t quickly commoditize.
We’ll place each yield component on this scale, define it in CRE terms, and show how software/AI shifts the frontier.
Alpha vs Beta (and Fees): A Plain-English Map for CRE
Total return = Market beta + Factor premia + Leverage effect + Skill (alpha) − Fees − Friction.
That’s how public-markets quants decompose equity returns. The same logic applies to CRE once you start attributing your yield waterfall.
Definitions that travel well from equities
-
Beta (market exposure). In equities, that’s owning the index. In CRE, it’s the income/cap-rate regime of your property type & market. You don’t create it; you take it.
-
Factor premia (“smart beta”). Systematic, repeatable tilts (e.g., value/quality/momentum in stocks). CRE analogs: location/supply tilt, asset quality/vintage, lease structure, operating model choices—things you can systematize.
-
Alpha (idiosyncratic skill). Returns from skill and execution not explained by beta or known factors: proprietary sourcing, measured renovation playbooks, proprietary data, durable ops excellence, location x product type selection/timing, capital-structure fit that avoids covenant traps.
Quick test: If 100 similarly resourced firms could clone the result by following a known recipe, it’s not alpha—it’s a factor (or beta). If only your team keeps doing it reliably because of process/data/relationships/culture, it’s alpha.
How this maps to your Yield Components
| Yield component | What it really is | Alpha↔Beta | Why | How AI/software shifts it |
|---|---|---|---|---|
| Base yield (cap rate) | Market income multiple | Beta | Regime you’re buying | Measurement improves; not control |
| Loss-to-lease capture | Pricing cadence & concessions discipline | Factor → semi-alpha | Repeatable with ops | AI pricing + AI leasing → trending toward beta if you don’t adopt |
| Occupancy / ops delta | Funnel, make-ready, collections, opex | Semi-alpha → alpha | Process & culture edge | Workflow telemetry makes it measurable / compoundable |
| Growth rates | Macro/micro rent & expense growth | Beta / factor | Exposure > control | Forecasts improve; still largely exposure |
| Renovation premium | Scope→premium after vacancy/creep | Alpha (if instrumented) | Design/cost/speed + proof | CV checks & unit-level A/B keep it alpha |
| Taxes | Assessment/appeal | Beta/drag | Mostly exogenous | Tools help appeal timing; still drag |
| Exit cap | Terminal multiple | Beta | Influence NOI quality, not regime | Better timing signals; still exposure |
| Leverage | Capital structure | Amplifier | Magnifies error or edge | Stress tests & covenant early-warning |
What should fees pay for?
-
Index-like beta: 3–15 bps in public markets → in CRE, your AM fee funds the plumbing (ingestion, controls, reporting).
-
Smart-beta factors: 15–40 bps → in CRE, systematic tilts & integrations/ops programs (still AM fee territory).
-
Alpha: 60–120 bps + performance fees → in CRE, carry (10–20%) above a hurdle should be tied to documented alpha only.
Principle: Don’t pay alpha fees for beta exposure. If lift came from market growth, cap-rate luck, or leverage, that’s not where carry should be earned. If it came from reno ROI that persists, ops that beat peers, sourcing/timing, market/asset selection, that is alpha—and worth paying for.
Tiny numeric example (illustrative):
Total equity return 17.2% → Beta 7.5%, Factors 4.0%, Leverage 3.7%, Alpha 2.0%.
Fees: 1.0% AM + 20% carry on alpha only = 0.4%. LP net ≈ 15.8% with clarity on what they paid for.
Component deep-dives (definitions • control • AI/software impact • pitfalls)
1) Loss to Lease (LTL) — +251 bps
- What: Spread between in-place rents and achievable market rents.
- Alpha↔Beta: 2.5/5 (trending toward beta with revenue-management adoption).
- Control: Renewal vs new-lease mix, pricing, concessions, turn time.
- AI/software: Dynamic pricing; AI leasing (speed-to-lead); lead scoring; turn-time prediction.
- Pitfalls: Chasing headline rent while eroding effective rent via concessions and days-vacant.
2) Occupancy / Operations — –121 bps
- What: NOI drag/lift from occupancy, delinquency, controllable opex.
- Alpha↔Beta: 3.5/5 (execution edge).
- Control: Funnel efficiency, make-ready SLAs, procurement, collections.
- AI/software: Funnel analytics; AI work-order routing; utility anomaly detection; variance attribution.
- Pitfalls: Treating occupancy as a single dial; it’s downstream of multiple levers.
3) Growth Rates — +380 bps
- What: Forward rent/expense/ancillary growth assumptions.
- Alpha↔Beta: 1.5/5 (mostly exposure).
- Control: Ancillaries, cadence, micro-market read.
- AI/software: Blend macro supply pipeline with micro leasing signals.
- Pitfalls: Copy-pasting broker decks; ignoring supply deliveries/affordability.
4) Renovation / Value-Add — +345 bps
- What: Capex scope → rent premium or expense savings.
- Alpha↔Beta: 4.0/5 (big alpha pool if instrumented).
- Control: Scope selection, cost control, speed, sequencing.
- AI/software: Unit-level A/B proof; computer-vision scope QA; ROI ladders by feature.
- Pitfalls: Counting gross lift; ignoring days-vacant and capex creep.
5) Taxes — –392 bps
- What: Assessment and policy drag.
- Alpha↔Beta: 1.0/5 (exogenous).
- Control: Appeals cadence, evidence, counsel.
- AI/software: Assessment comp detection; auto evidence packs.
- Pitfalls: Flat % of EGI underwriting; ignoring reassessment rules.
6) Exit Cap — +42 bps
- What: Terminal multiple you assume/realize.
- Alpha↔Beta: 1.0/5 (beta).
- Control: De-risk NOI, buyer packaging, timing.
- AI/software: Cap-rate bands by micro-type; timing scenarios.
- Pitfalls: Using exit cap as a plug.
7) Leverage — +519 bps
- What: Capital structure effect on equity yield.
- Alpha↔Beta: 1.5/5 (amplifier, not alpha).
- Control: Fixed/float mix, IO period, covenant headroom, maturity fit.
- AI/software: Debt scans; covenant stress tests; hedge optimizers.
- Pitfalls: Mistaking leverage-boosted returns for skill.
What "AI" just turned from alpha into beta (or "negative alpha" if ignored)
-
Doc ingestion → structured data (OMs, T-12s, rent rolls, loan docs). Yesterday: manual craft; today: table stakes.
-
Dynamic pricing + leasing ops. Increasingly standard; edge shifts to change management & iteration speed.
-
Scenario discipline. Standard packs baked into workflow.
-
Packaging. Lender/LP/IC outputs generated from structured data with provenance.
Where "real alpha" still hides (and compounds)
-
Sourcing & timing (proprietary data & channels; being ready for capricious sellers).
-
Value-add playbooks (scope→premium ladders tuned by submarket/asset DNA).
-
Operational culture (lead-to-lease speed, make-ready SLAs, collections discipline that survive staff churn).
-
Data feedback loops (instrumenting units & turns; learnings push into next bids).
-
Capital-structure fit (debt matched to plan; covenant early-warning embedded in AM).
-
Programmatic M&A (standardized UW + post-close telemetry).
A simple attribution framework you can use ASAP
-
Instrument ingestion. Parse OMs/T-12s/rent rolls into structured fields with source links.
-
Underwrite in your Excel (BYO-Model). Feed from the structured layer; tag assumptions/provenance.
-
Pre-declare levers. LTL, ops, reno ROI, taxes, exit cap, leverage.
-
Run standard scenarios. Rate paths, exit bands, supply shocks.
-
Attribute quarterly. Measure realized contribution vs plan for each component; close the loop.
-
Publish the waterfall. IC/LPs see consistent, auditable attribution and fees aligned to alpha.
The big picture
As more firms converge on similar efficiency frontiers—faster ingestion, cleaner underwriting, crisper scenarios—the bar for true alpha rises. That’s healthy.
Markets will reward operating excellence, data-driven value-add, and smarter capital structures, not spreadsheet heroics.
If your team can’t articulate where return comes from and which levers you actually control, you’re not managing risk—you’re hoping. The yield components waterfall forces the conversation and, with the right software + data + AI, turns it into a repeatable operating system.
Want this on your next deal?
Bring an OM, T-12, rent roll, and (if you want) your Excel. We’ll parse the docs, pipe the data into your model, and generate a yield-attribution waterfall with live scenarios—so you can see exactly where your return is supposed to come from (and how to pull those levers).
