A broker sends you two trailing 12s for the same property — one from six months ago, one current. Your analyst opens both files, starts toggling between tabs, manually calculating variance on revenue line items, trying to reconcile why total operating expenses jumped while the expense ratio supposedly improved.
It’s tedious. It’s error-prone. And it’s happening on every deal.
Now multiply that by every asset in a portfolio. A lender monitoring covenant compliance. A debt broker validating borrower financials before sizing a deal. An asset manager tracking performance across 50 properties where each property manager sends a different format.
This isn’t a one-time analysis problem. It’s a recurring one — monthly, quarterly, every time a new operating statement lands in someone’s inbox.
We built T12 Comparison to eliminate that manual reconciliation entirely.
What T12 Comparison Does
Upload two operating statements for the same property — different time periods, different sources, different formats. Archer parses both, maps them to your Custom Chart of Accounts, and delivers the complete financial comparison automatically. Not a tool for your analyst to build the analysis. The completed analysis, ready for a decision-maker to act on.

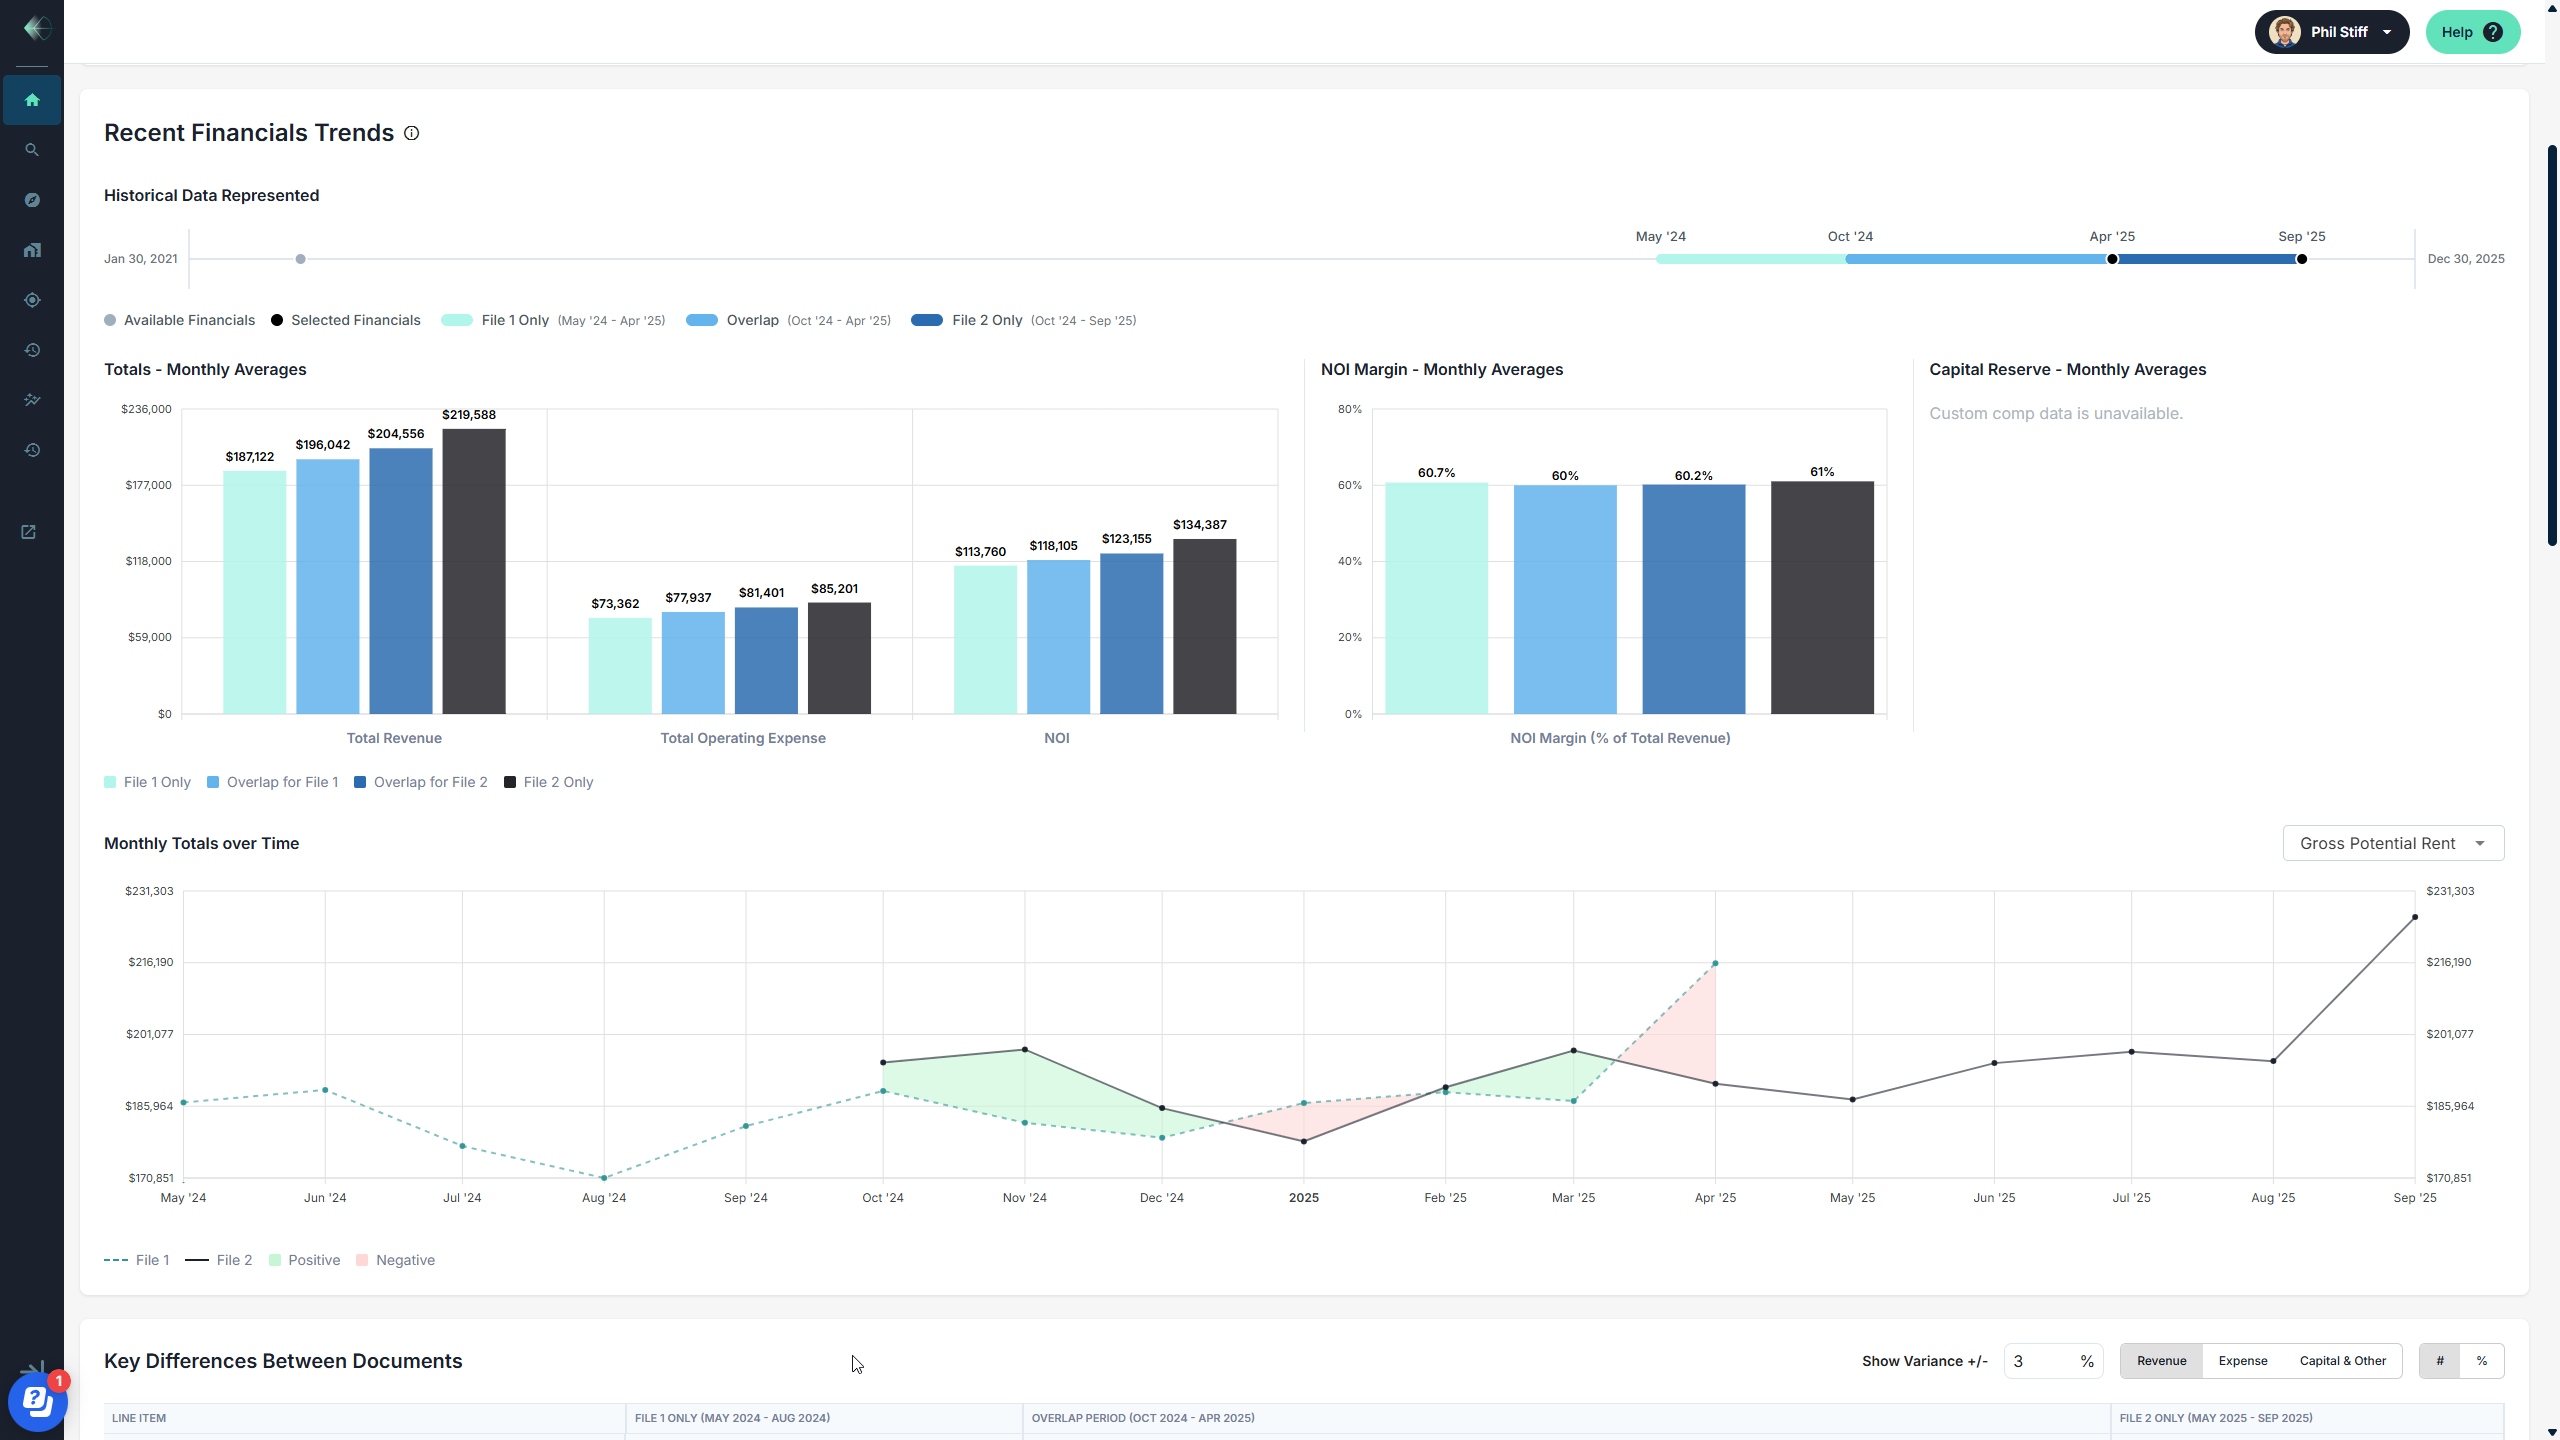
Here’s what surfaces the moment parsing completes:
Annualized summary with period-over-period variance. Total revenue, total operating expense, NOI, and expense ratio — previous versus recent, with the dollar and percentage change calculated automatically. In the example shown, revenue grew by $221,924 while operating expenses increased by $83,446, driving NOI up by $138,479. The expense ratio improved from 40% to 39%. That story takes seconds to read.

Monthly averages with visual breakdown. See monthly average revenue, expenses, and NOI side by side — with the overlap period isolated so you can see exactly where performance diverged. The bar charts show how the property’s financials evolved over the combined timeframe, making it immediately clear what changed and when.
NOI margin trending. Track NOI as a percentage of total revenue across both periods. In this case, NOI margin held steady around 60–61% — a signal that revenue growth isn’t being eaten by expenses. That’s a confidence check that used to require building a separate analysis.
Monthly totals over time. A line chart showing how gross potential rent (or any selected metric) trended month by month across both files. Seasonality, rent bumps, anomalies — they all become visible. The shaded areas highlight positive and negative variance between periods, making trend analysis visual and intuitive.

Row-level discrepancy tracking. Archer flags exactly which line items were added or removed between the two files — 6 previous rows removed, 11 recent rows added in this example. Filter by revenue, expense, or capital items and set a variance threshold so you’re only looking at the differences that matter.
For Deal Teams: Financial Diligence at the Speed of Screening
When you’re evaluating a new acquisition or origination, the T12 Comparison gives your team the financial trending story instantly. Is revenue accelerating or flattening? Are expenses growing faster than income? Did the operator reclassify line items between periods?
These are questions that typically surface deep in the underwriting process. With Archer, they surface before anyone has opened a model. Your acquisitions director gets a clear read on financial trajectory — and your analysts spend their time on the deals that deserve a deeper look, not on reconciling spreadsheets for deals that don’t.
And because both T12s are parsed to your Custom Chart of Accounts, the comparison is apples-to-apples regardless of how the property manager formatted the original files. Fannie Mae format to Freddie Mac format? Archer normalizes both to your CoA in seconds.
For Lenders, Debt Brokers, and Asset Managers: The Recurring Analysis You No Longer Have to Build
Here’s what makes T12 Comparison different from a one-time feature: this is analysis that needs to happen every reporting period, for every asset, for as long as you hold or service it.
Lenders monitoring a loan book need quarterly variance analysis to track covenant compliance. Debt brokers sizing a deal need to validate the borrower’s financials against prior periods before going to market. Asset managers tracking a portfolio need to compare every new P&L to the last one and flag where performance is diverging from underwriting assumptions.
Today, that work is manual. Every quarter, someone reformats the new operating statement to match the prior period’s layout, calculates variance line by line, and builds a summary. Multiply that by a portfolio of 20, 50, or 200 assets and you have a team spending days on work that produces the same deliverable every cycle.
With Archer, the moment a new operating statement arrives, you upload it and select the prior period file. The comparison generates automatically — revenue trending, expense variance, NOI trajectory, row-level discrepancies — all mapped to your Chart of Accounts. Whether that’s Fannie Mae, Freddie Mac, or your internal balance sheet categories, Archer normalizes and compares with perfect fidelity. Same property, different lens, one click.
That’s not a faster spreadsheet. It’s a monitoring system that produces institutional-quality analysis every time a new file comes in.
With AI it's AND — Archer Makes Data AI-Ready
AI is changing how CRE teams work — and we’re all in on it. Our clients are using tools like Claude and Claude for Excel to ask smarter questions, build internal tools, and improve workflows in ways that weren’t possible a year ago. We actively encourage it!
But AI is only as good as the data you give it. And that’s where the real gap shows up — not in the intelligence of the model, but in the quality of the inputs. When your operating statements have already been parsed, auto-mapped to your Custom Chart of Accounts, and stored with persistent institutional memory, AI can do extraordinary things with that data. When they haven’t, you’re starting from scratch every time.
That’s the role Archer plays. We make your financial data AI-ready — structured, normalized, consistent, and enriched with 5+ years of domain-specific training on 100K+ documents and 130K+ unique financial line items. The T12 Comparison is a clear example: two files parsed to your exact CoA categories, compared with line-level precision, and ready to feed into whatever analysis or AI workflow your team is building next.
It’s not Archer or AI. It’s Archer AND AI. The best teams we work with are combining both — and the results compound.
Every T12 Builds Your Edge
The T12 Comparison isn’t a standalone feature. It’s part of the analytics layer that activates the moment you parse any financial document in Archer. Alongside the Lease Trade Out Report, Rent Roll Summary, and portfolio benchmarking, it delivers intelligence at the beginning of the process — not the end.
And every T12 you parse automatically generates proprietary expense comps at your Custom Chart of Accounts level. The more files your team processes, the more granular and defensible your benchmarking data becomes. That’s a compounding advantage that grows with every reporting cycle.
--
T12 Comparison is live for all Archer clients. Log in and try it on your next deal, or book a walkthrough to see it in action.